Helpers, Utils and Hot Spots
In my last post I talked about the danger of having classes with names that end in “helper”, “util”, “impl” in your codebase and how you should avoid them. To carry on with that topic I’ve found some, albeit loose, evidence that visualises the phenomenon and supports my claims. I came across a fantastic book called Your Code as a Crime Scene by Adam Tornhill which is all about mining your version control system to gather insights about a project’s evolution, how your team interacts with the code, any productivity bottlenecks and information on growing areas of concern. What’s more is Tornhill’s take on software development. He holds degrees in two subjects and has parallel careers as both a software developer and a forensic psychologist, and with that the lens through which he views software evolution is quite interesting.

Whilst the book does cover a number of interesting observations and techniques for analysis you can run on your own codebase, I’ll only be focusing on one technique in this post which is the concept of “hot spots”. Towards the beginning of the book Tornhill talks about geographical offender profiling and how a similar technique can be used to find the areas of our codebases that are potentially causing us the most pain. I won’t go too much into specifics as the book and his talks do a much better job of that, I’d say grab a copy of the book, read his site or catch his TEDxTalk covering the book to find out more.
Geographical Profiling and Problem Classes
Your Code as a Crime Scene provides a brief explanation of geographical offender profiling and how the same technique can be applied to a codebase. The idea is that serial offenders generally commit their crimes in places that they are familiar with and are not typically commited in non-related geopgraphical locations. These locations can then be used as data to generate an overlay on a map which shows the area most likely to contain the offender’s base of operation. Tornhill explains this as follows:
The basic premise is that the geographical location of crimes contain valuable information. For a crime to occur, there must be an overlap in space and time between the offender and a victim. The locations of crimes are never random. Most of the time criminals behave just like ordinary, law abiding citizens. They go to work, visit restaurants and shops, maintain social contacts. During these activities, each individual builds a mental map of the geographical areas he visits and lives in. It’s a mental map that will come to shape the decision on where to commit a crime. – Adam Tornhill
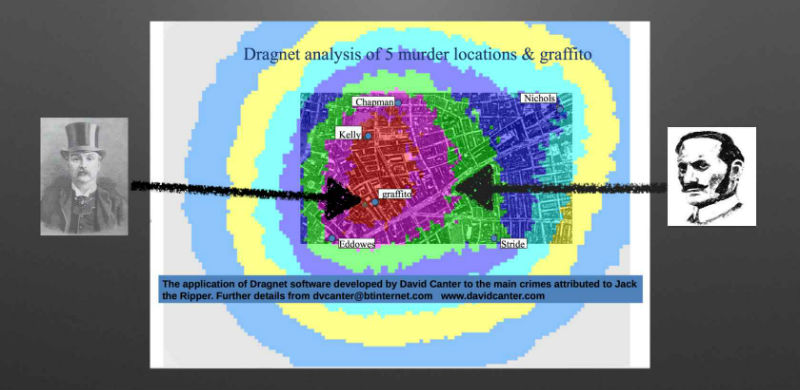
This technique can be used to help law enforcement agencies narrow their field of focus and concentrate their resources in the area with the highest chance of catching the offender. Your Code as a Crime Scene presents the technique applied to the Jack the Ripper murders which can be seen below, and given the data, the area marked in red is perhaps where he was operating out of. Interestingly, one of the suspects, James Maybrick, who was a cotton merchant from Liverpool would rent a flat that was situated in the red area of the map whenever he visted London on business. He’s the guy with the tophat on the left.
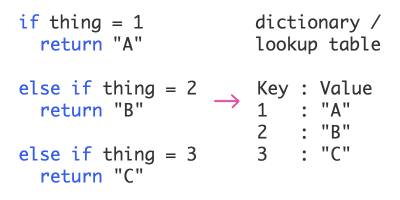
Do we have any serial offenders hiding in our own codebases, and if so what are they called? The book also points out that we should use our intuition to spot likely offenders by applying simple heuristics such as looking first at the names of classes, which I think is a sensible first test. If you see a class called SomethingHelper or SomethingElseUtil, you can probably say with some degree of certainty that it may be a little smelly.
Directed Refactoring via Hot Spots
Why then is the above technique for profiling useful when applied to a codebase? Keeping a full view of any non-trivial project in our heads and the parts which are potentially degrading overtime is too much for us to process. We can use tools like SonarQube to tell us which files are violating the most syntactic rules but that’s only one side of the story. If we were to follow the recommendations of a code quality tool then we could potentially end up focusing our efforts in the wrong places by refactoring stable modules that don’t change very often.
It would be good if there was some way to find the files that are not only complex but are also changing often, these are the ones we should be most interested in as they are the files that could be currently causing us issues. Fortunately Adam Tornhill has written an app called Code Maat that does exactly that, plus other interesting types of analysis. Code Maat uses your project’s version control history to find the complex files that we have to work with often (the hot spots) and outputs a json file that can be used to generate a D3 visualisation of them. Hot spots are defined as an overlap in complexity and effort, where the complexity metric used is the number of lines of code in a file and effort is the number of commits. We can then use the hot spot visualsation to get a high level overview of all the files that may be causing productivity issues. Much like the offender profiling above, we’ll have narrowed the scope of our search to the areas where we’re most likely to find the offender, or in this case the files that need refactoring the most.
To run the analysis yourself you’ll need to grab a copy of Code Maat and follow the instructions over on the repo here. There are a number of steps involved in generating the visualisation file which are just enough to get tedious everytime you want to run the analysis, I’ve written a Bash script which you can find here that automates them. I didn’t spend massive amounts of time on the automation script so a few of the parameters that Code Maat accepts are missing but feel free to contribute. All of Code Maat’s functionality is actually already automated in the service that it evolved into called CodeScene which is free for up to 10 repositories with 5,000 commits or less.
With the above in mind I had a look around some open source projects on GitHub and ran them through the analysis on CodeScene to see if there were other projects out there in the wild with hotspots in helper, util and impl classes. Below you’ll see the CodeScene / CodeMaat hotspot analysis for 4 projects, which haven’t been selected for any particular purpose and this is by no means an exhaustive audit of a wide variety of projects. I chose these 4 as ASP.NET Core MVC is featured in the CodeScene showcase, the Hibernate analysis comes with Code Maat as a sample, Vue.js was trending on GitHub and I already had a branch of Sequelize. Also as an aside, the analysis for both Hibernate and Sequelize was performed on old versions of the code which are a number of years old.
Hot Spots in the Wild
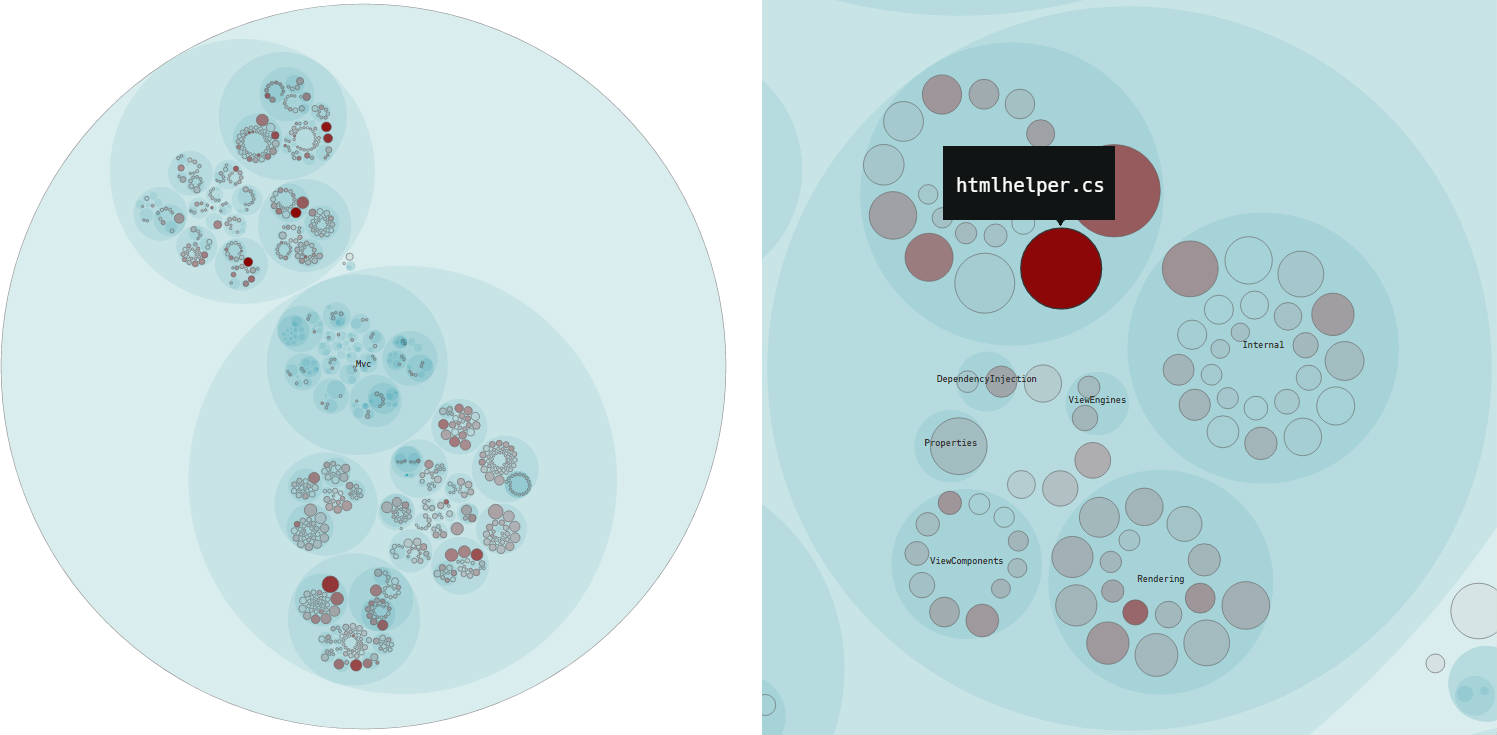
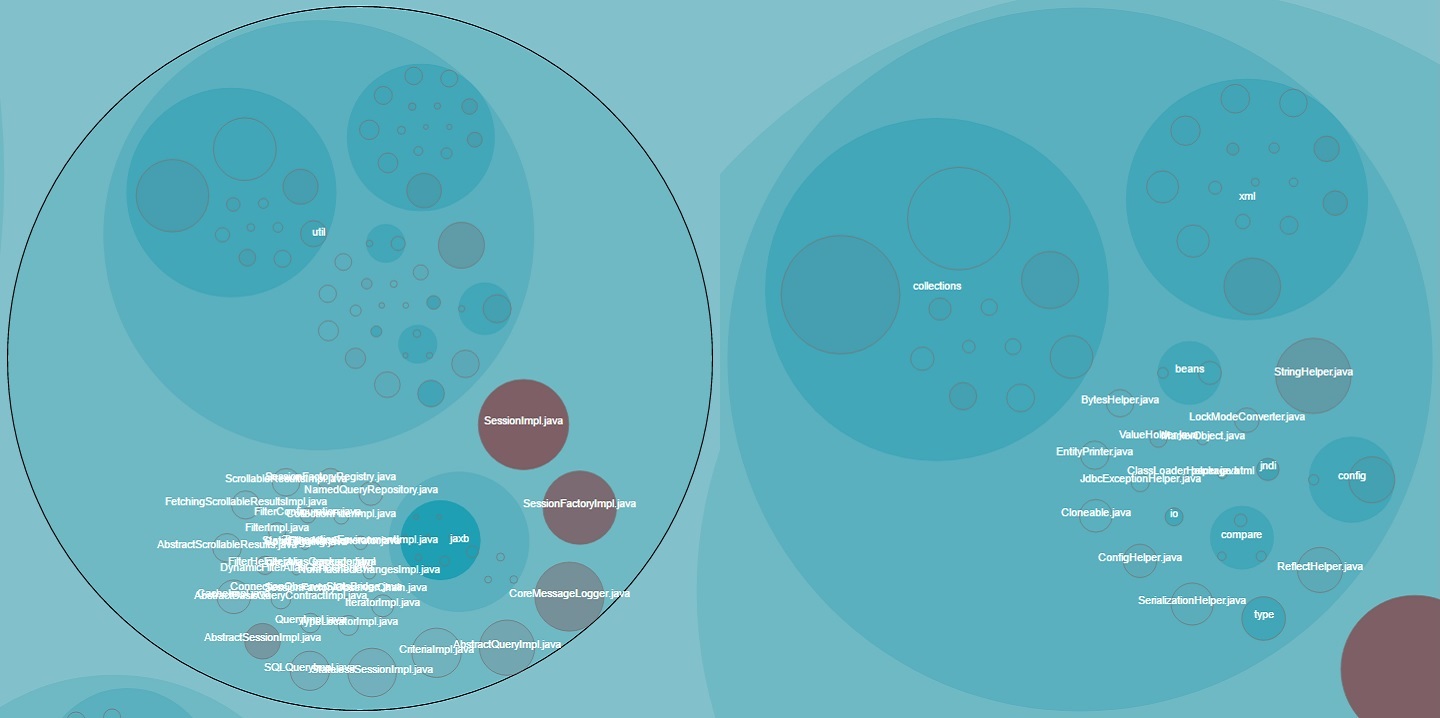
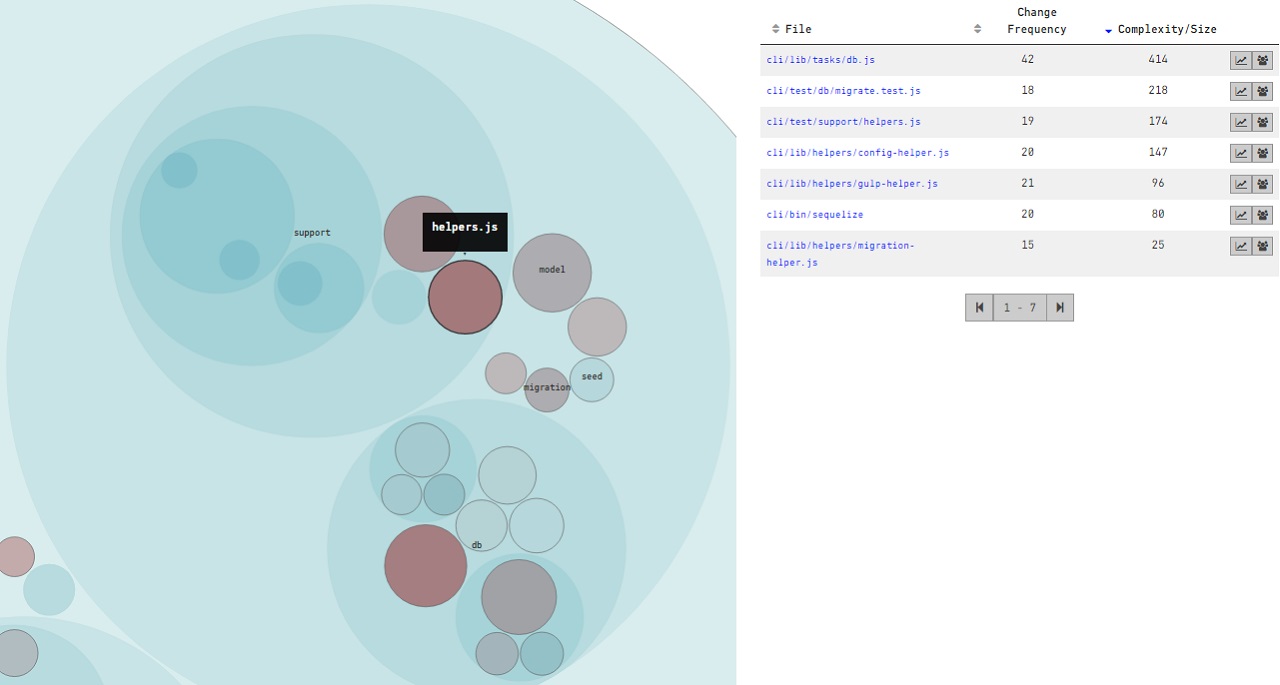
Whilst there are hotspots in other files in each of the projects that don’t have helper, util, impl in their name, I thought it was interesting that the analysis from CodeScene / Code Maat does tend to corroborate that files with these sorts of names do flag up as potential problem areas in a codebase. The petri dish looking things below are the D3 visualisations you’ll get out of Code Maat and CodeScene, the larger the circle the more complex it is and the darker the colour the more commits it has. The dark red areas are the hot spots:
ASP.NET Core MVC
Hibernate
Sequelize
Vue.js
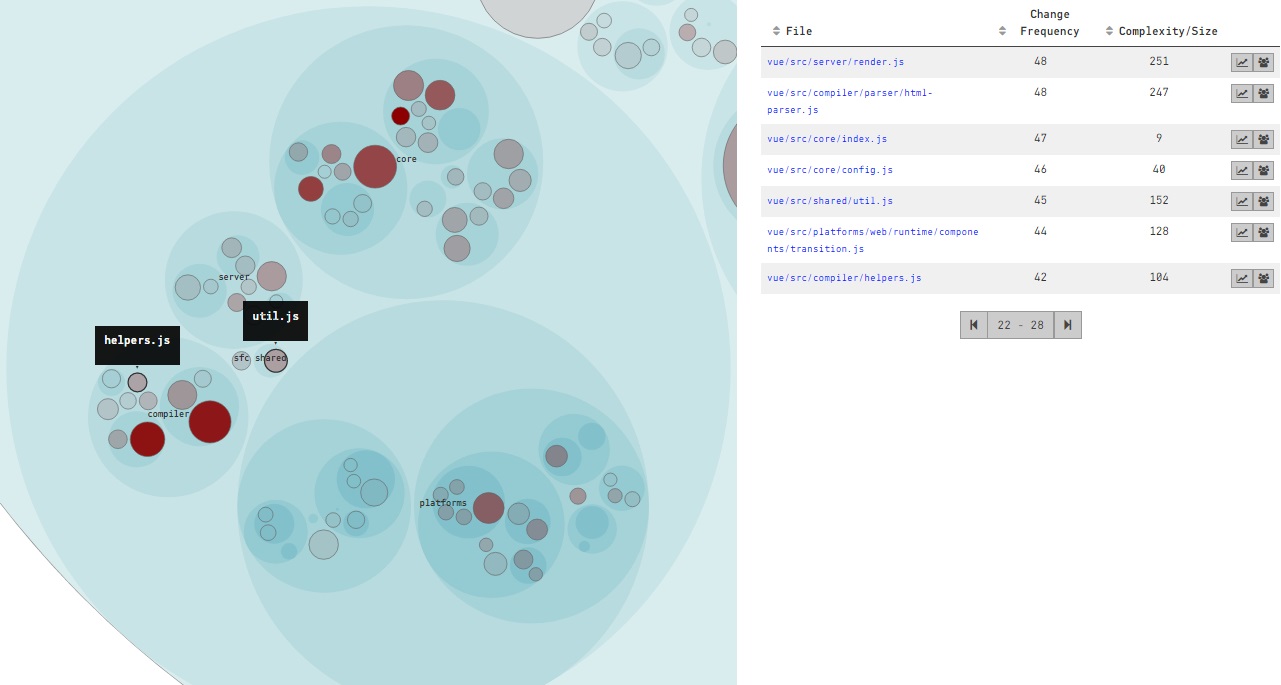
It’s interesting to see that each of these projects currently have or has had hotspots in files with helper, util or impl in their name. Further to my last post, I think the reason these types of classes go on to become hot spots is because they are inappropriately intimate with many other classes, and when the requirements of one of their consumers changes, so must they, and likely the other classes who are also consumers. This would explain why the number of commits to these classes is generally higher, either the methods in them are constantly in flux or new methods are being added. In summary, code quality tools are good for informing us which files contain the most syntactic violations, but tools like Code Maat and CodeScene provide the extra dimension we need to find the files that are most pertinent for timely refactoring. Which likely includes those cheeky helpers!